Bluetooth Explorer:AI Terminal
User Guide
Follow the screenshots in order to complete a full workflow: scan devices, inspect services,
debug characteristic data, analyze logs, and use AI hints to resolve issues faster.
How to Use This Manual
This guide mirrors your in-app journey. Open each section, compare it with the screenshot,
then follow the action checklist. For fastest debugging: complete Step 1 to Step 9 in sequence.
1
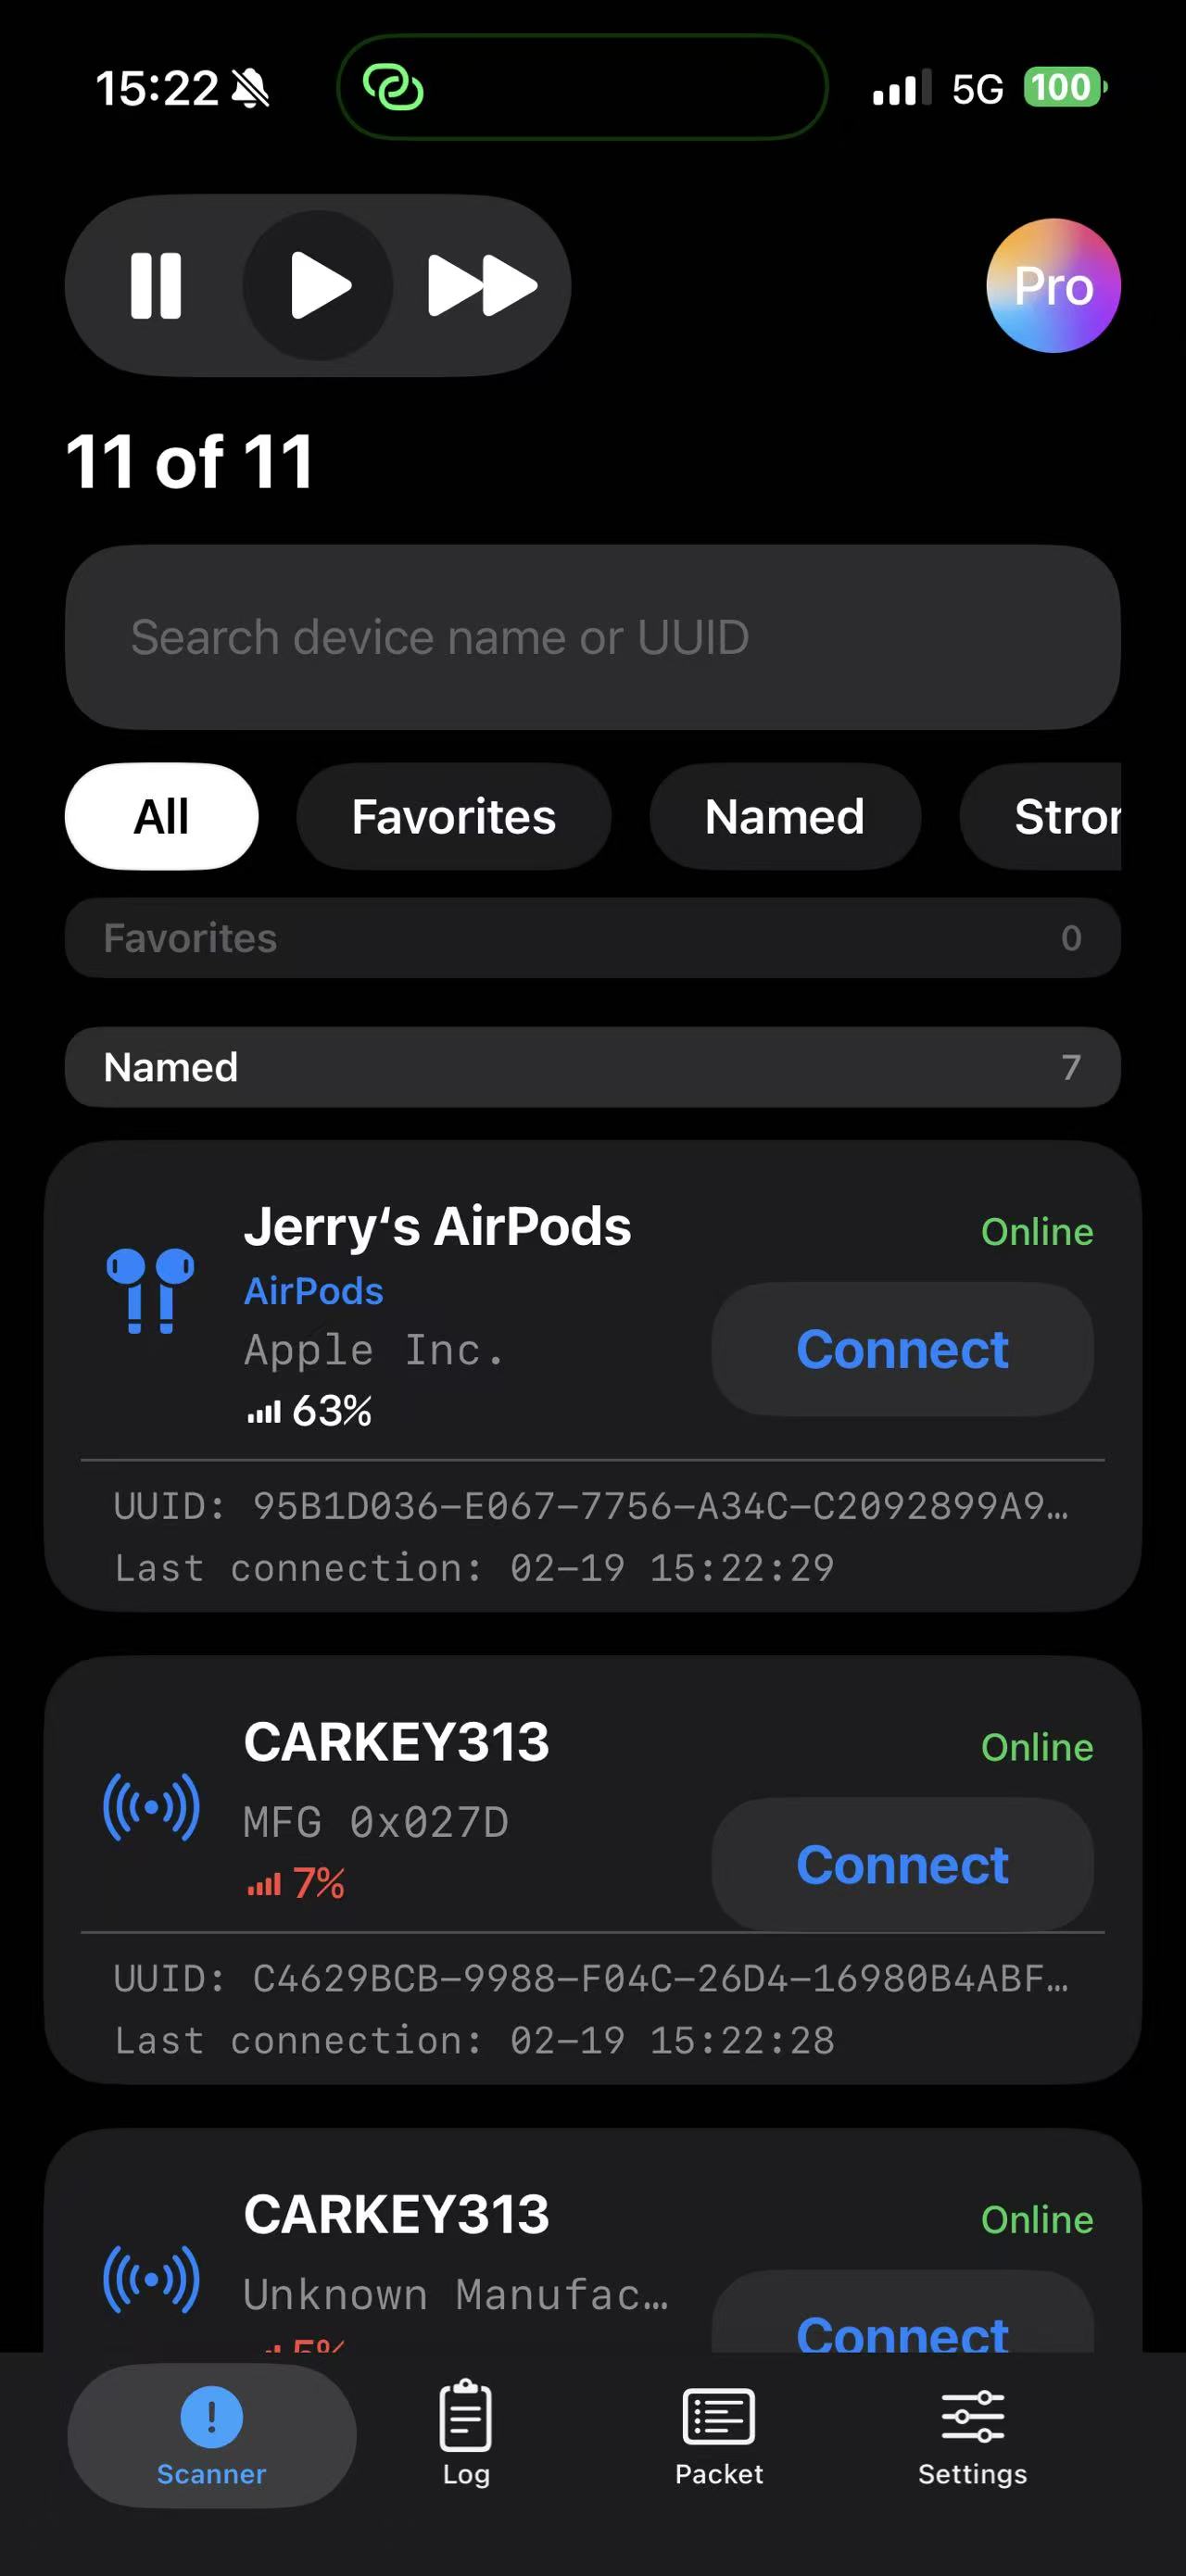
Scanner Home
Start from the Scanner tab to discover nearby Bluetooth devices and pick a target quickly.
What You See
- Scan controls (stop / play / fast), search box, and filter chips.
- Device cards with name, manufacturer, battery, and online state.
- Direct Connect action for each device.
How to Use
- Use fast scan during discovery, then switch to normal scan to reduce noise.
- Filter by Named or Favorites when too many devices are present.
- Tap Connect on your target device to enter interrogation flow.
2
Device Information & Service Tree
After connection, this page gives a full status snapshot and all discovered services/characteristics.
What You See
- Signal, connection state, service count, and quick actions (Export/Broadcast/Navigation).
- Service sections with characteristics you can inspect and debug.
- AI diagnostics entry point for one-click analysis.
How to Use
- Confirm connection is healthy before writing payloads.
- Open a characteristic row to enter read/write debug mode.
- Use Broadcast when you need raw advertising details from the same device.
3
Rename Device & Correct Type
Apply a project-friendly alias so your team can identify test units instantly.
What You See
- Edit Device Name dialog with restore and save controls.
- Keyboard input for quick alias updates on-site.
How to Use
- Use naming convention like LineA-Node03 or AirPods-Test-01.
- Tap Restore Original if you need to match manufacturer naming again.
- Save before exporting logs so reports remain consistent.
4
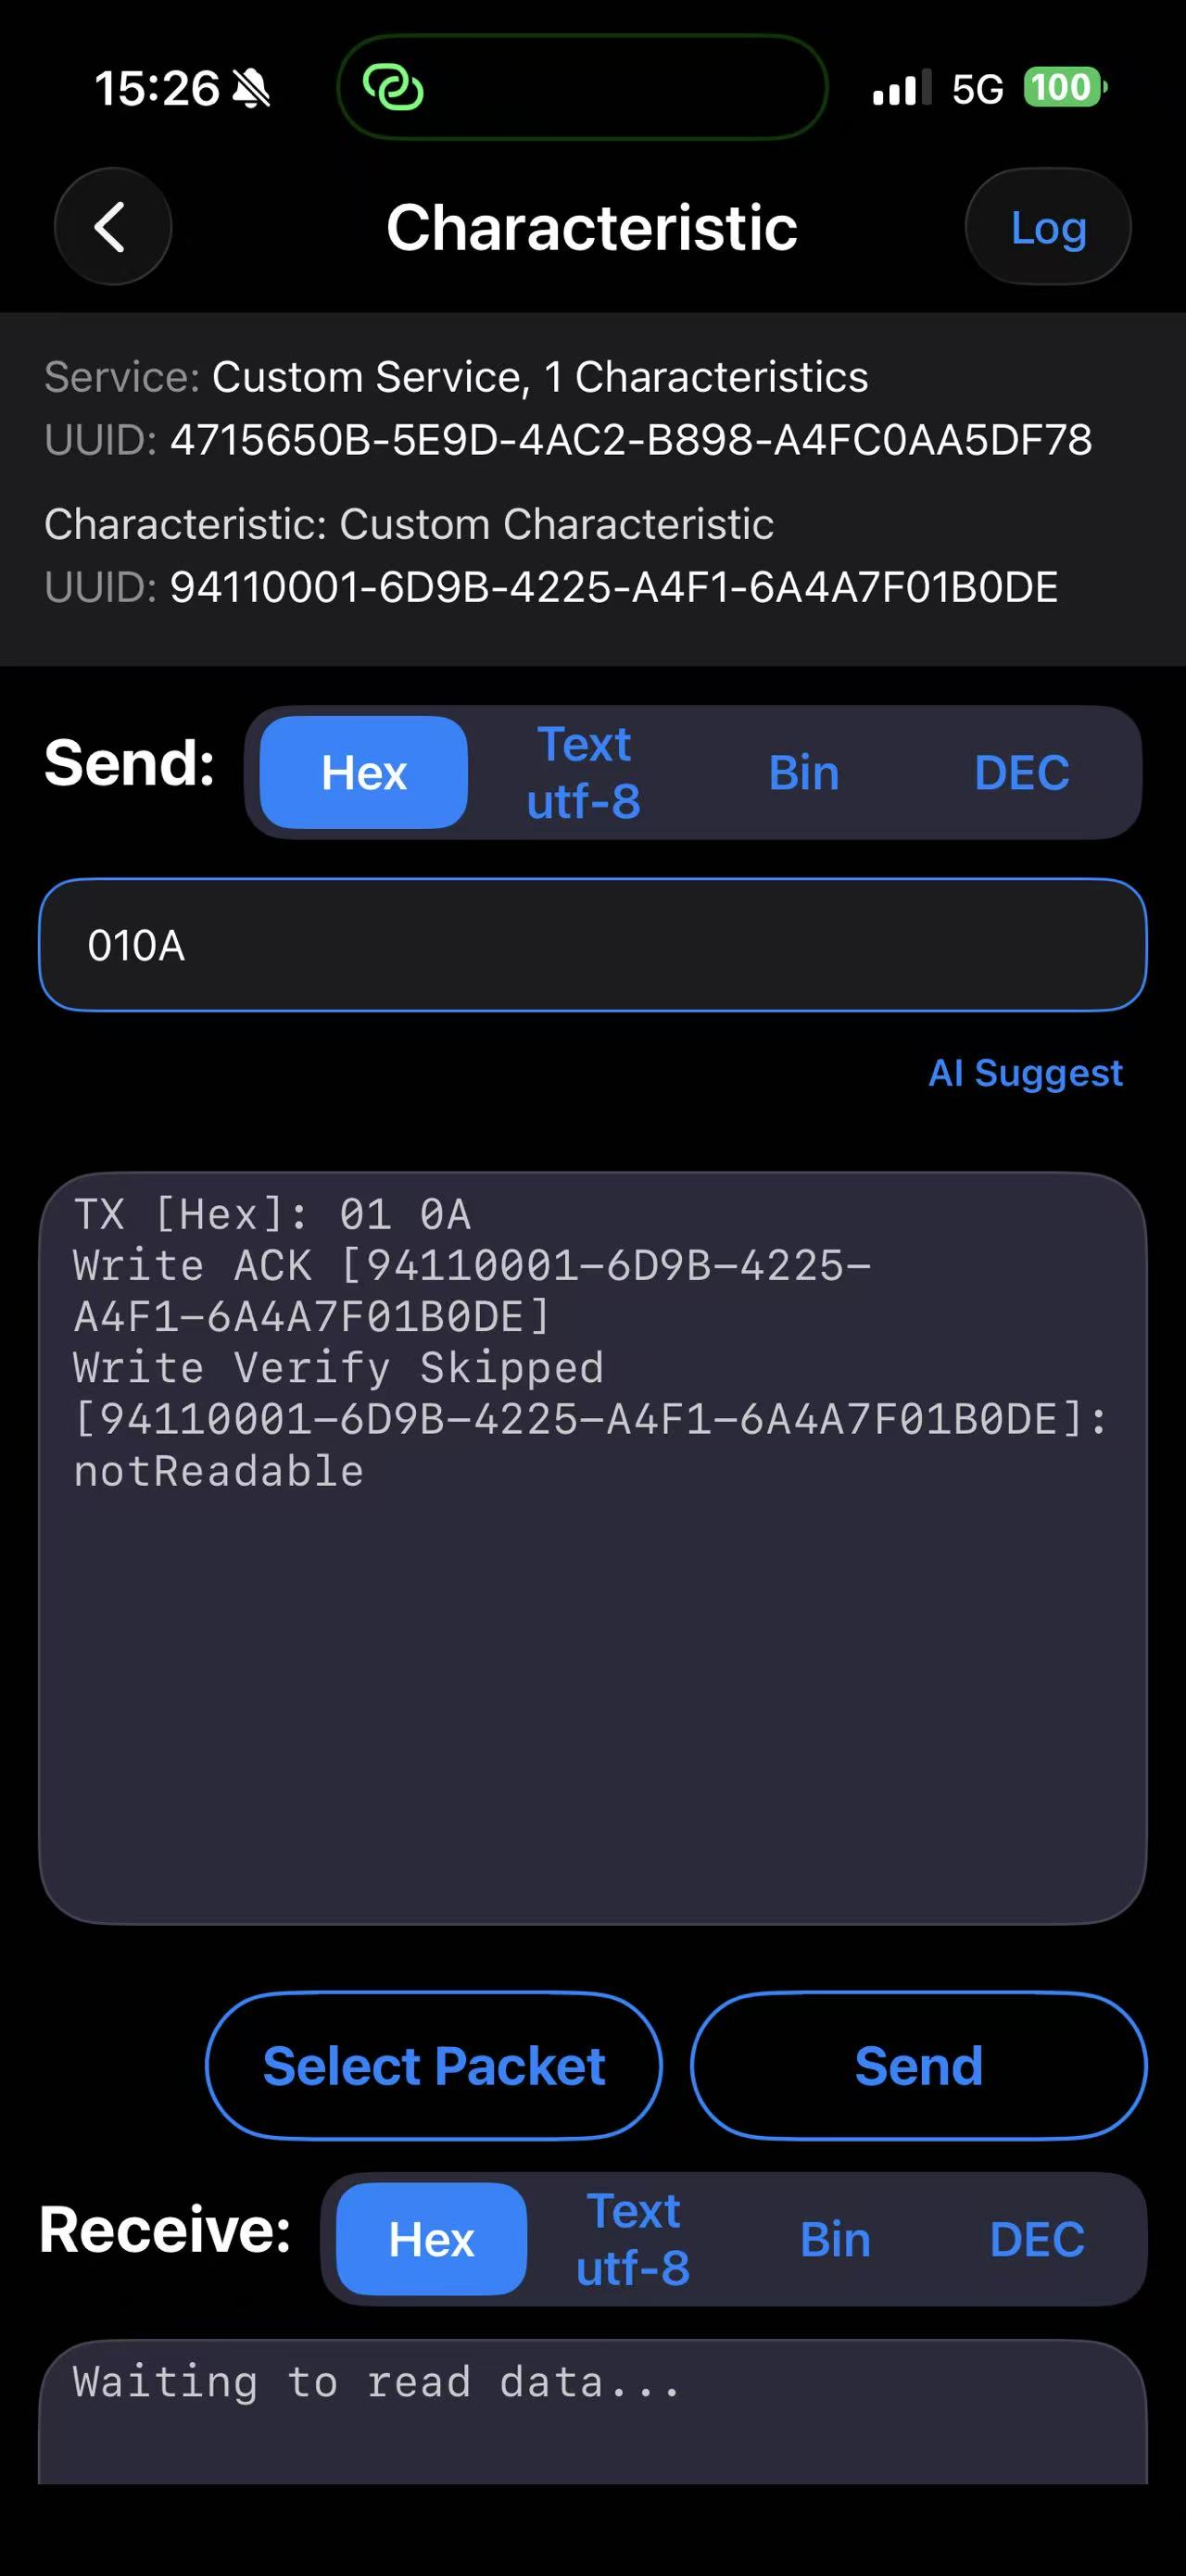
Characteristic Debug Console
The core terminal for payload write/read verification across HEX, Text, Binary, and Decimal modes.
What You See
- Send mode selector and payload input area.
- Live send output with ACK/write verification feedback.
- Receive mode section and quick actions: Select Packet / Send.
How to Use
- Pick an encoding mode matching your firmware protocol.
- Send a known safe command first to confirm path integrity.
- Review output text to validate write success and expected response.
5
Select Packet for Repeatable Tests
Reuse saved command packets to avoid manual retyping and improve regression consistency.
What You See
- Bottom sheet packet picker with packet name, payload, and mode.
- Quick add entry point for creating new reusable packets.
How to Use
- Define packets for handshake, version check, and diagnostics.
- Use packet names that encode intent, for example auth init.
- Combine with Step 8 logs to compare packet outcomes across builds.
6
Navigation Finder
Use signal-aware navigation assistance when you need to physically locate the connected device.
What You See
- Map context with target marker and live progress indicator.
- Distance, mode, and real-time status panel.
How to Use
- Walk slowly and monitor signal/percentage trends.
- If signal drops, rotate and re-approach from another direction.
- Tap Found when target confirmation is complete.
7
Packet Library Management
Maintain a clean command library for team-wide reuse and quick test setup.
What You See
- Packet list by name and mode, plus add button.
- A dedicated tab to centralize command management.
How to Use
- Create one packet set per firmware feature area.
- Keep packet names short but explicit for faster lookup.
- Review stale packets after protocol revisions.
8
Session Log Timeline
Track every key event in one place: scanning, connection, writes, reads, and diagnostic outputs.
What You See
- Timestamped rows with level tags (INFO / CONN / etc.).
- Clear, Export, and mode controls for practical analysis.
- AI Insights entry at the bottom for instant summary.
How to Use
- Export logs right after reproducing an issue.
- Mark key commands in packet names to correlate log events faster.
- Use clear before a fresh test run to isolate noise.
9
AI Insights
Convert raw communication history into actionable hints for protocol and pairing troubleshooting.
What You See
- Device context, log sample size, and protocol hint card.
- Confidence score to help prioritize next debugging actions.
How to Use
- Read AI hints after at least one full connect/read/write cycle.
- Use confidence score as guidance, then validate against raw logs.
- Apply recommendations, rerun packet tests, and compare outcomes.
Recommended Workflows
Choose the path that matches your objective.
Fast Device Bring-up
Step 1 → 2 → 4 → 8 → 9
Scan, inspect, write test payloads, export logs, and confirm AI diagnosis.
Field Finder Flow
Step 1 → 2 → 6
Find the right device, verify identity, then navigate physically to target.
Regression Packet Run
Step 7 → 5 → 4 → 8
Load saved packets, run repeatable commands, and archive test evidence.